Fix your Angular errors faster than ever
Debugging tips and tricks
In this article, we’ll cover some debugging tips and tricks we’ve learnt along the way.
Tips for Debugging Angular Applications
Where was the error first encountered?
- During the build. Did the
npm startprocess just quit? Then that’s a problem with the build process. We won’t deep dive into this issue throughout this article, but you can dig deep into those using a great tool by Google, called ndb . Install it andndb npm start. - Does it work fine locally, but then breaks once deployed ? It could be a problem with the production code. Production code contains minified code, meaning your errors might be a bit harder to track down. The following guide from AngularInDepth demonstrates what these look like and can help you find the root cause.
- The most common errors, are errors on your local development build . For that, read on!
Your IDE can help you!
What was that property again? Was it user.name or user.fullName?
Yes, Angular comes with TypeScript baked in, but it’s still based on JavaScript, and there’s a number of reasons why your IDE isn’t helping you:
1. Laziness — You or someone else used any, explicitly or implicitly. Use the new --strict operator, introduced in v10 . If your app has fewer defects, your IDE helps you, and best of all, your app is actually smaller because tree-shaking works better.
2. Tooling Failure: Your Angular / TypeScript service has crashed. If it’s constantly slow or crashing, one of the solutions may be to switch from VSCode to Webstorm .
3. Architecture Issues: This could also be a sign that your team needs to make use of Domain-Driven Design .
4. Typings: You may have forgotten to install @types/my-package.
5. Cutting edge: Some coding patterns, like TypeScript mixins, rely more on runtime and your codebase to ensure certain types are in sync .
Intellisense demo from the official Visual Studio Documentation
Chrome
Chrome is one of the best tools available for investigating frontend issues .
Let’s start with a common problem - a memory leak. Open the chrome “Performance” and “Memory” tabs. A surefire way to catch a leak is to watch out for a graph going up. This means your app is consuming more resources as time passes.
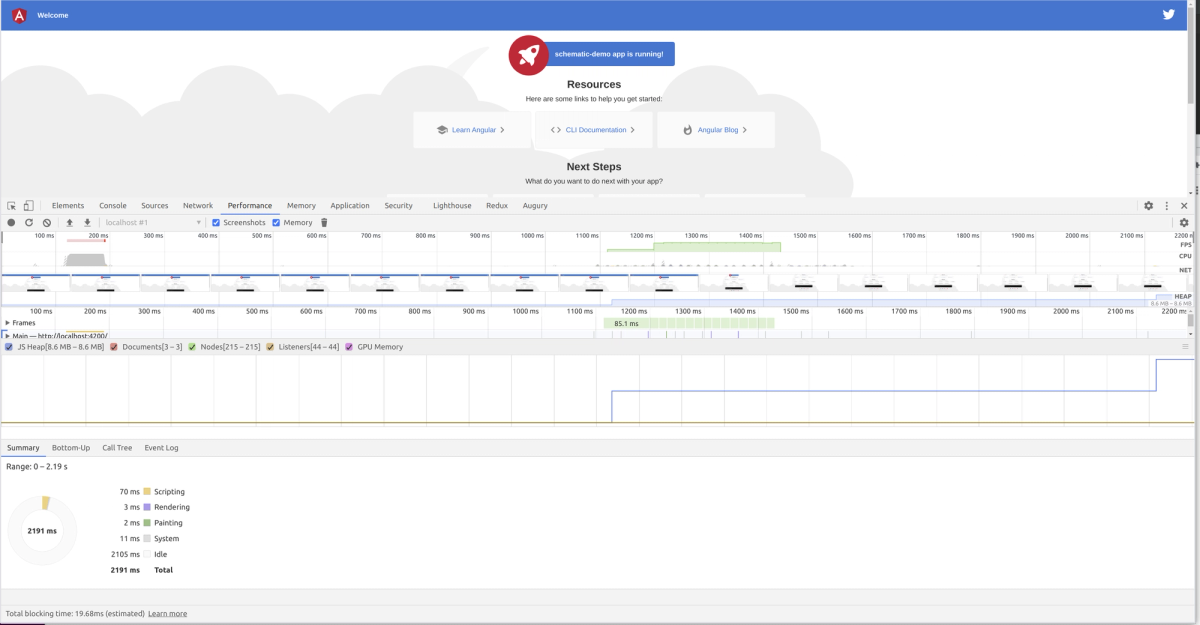
Memory Profiler on the Chrome webpage. This is useful for detecting memory leaks and for detecting long GPU/rendering delays
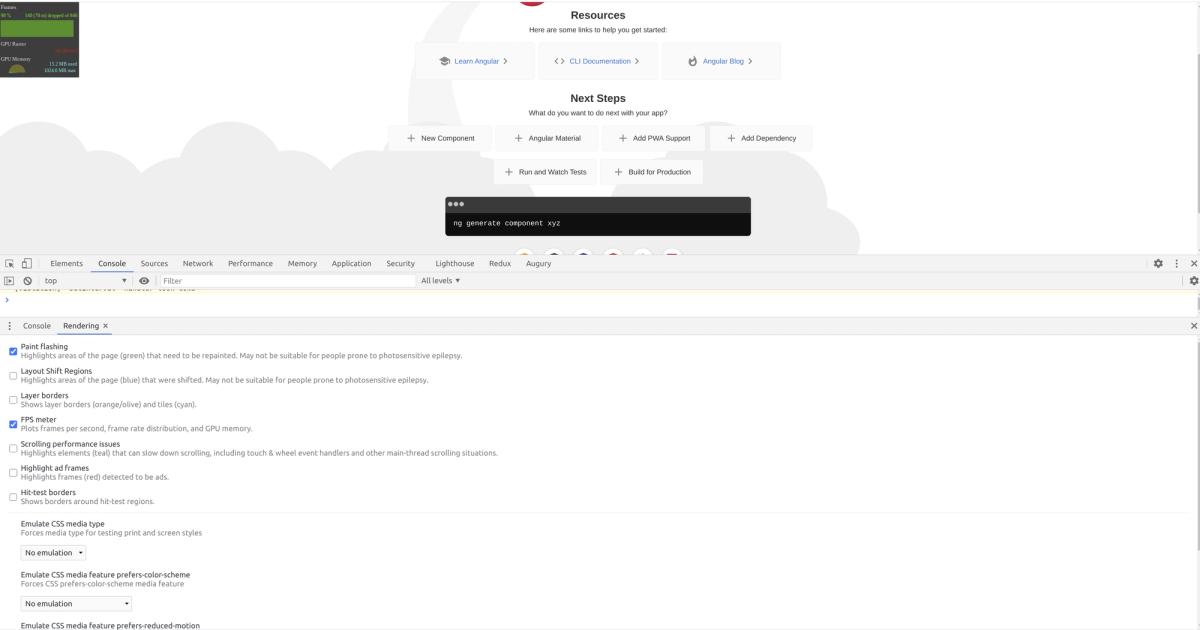
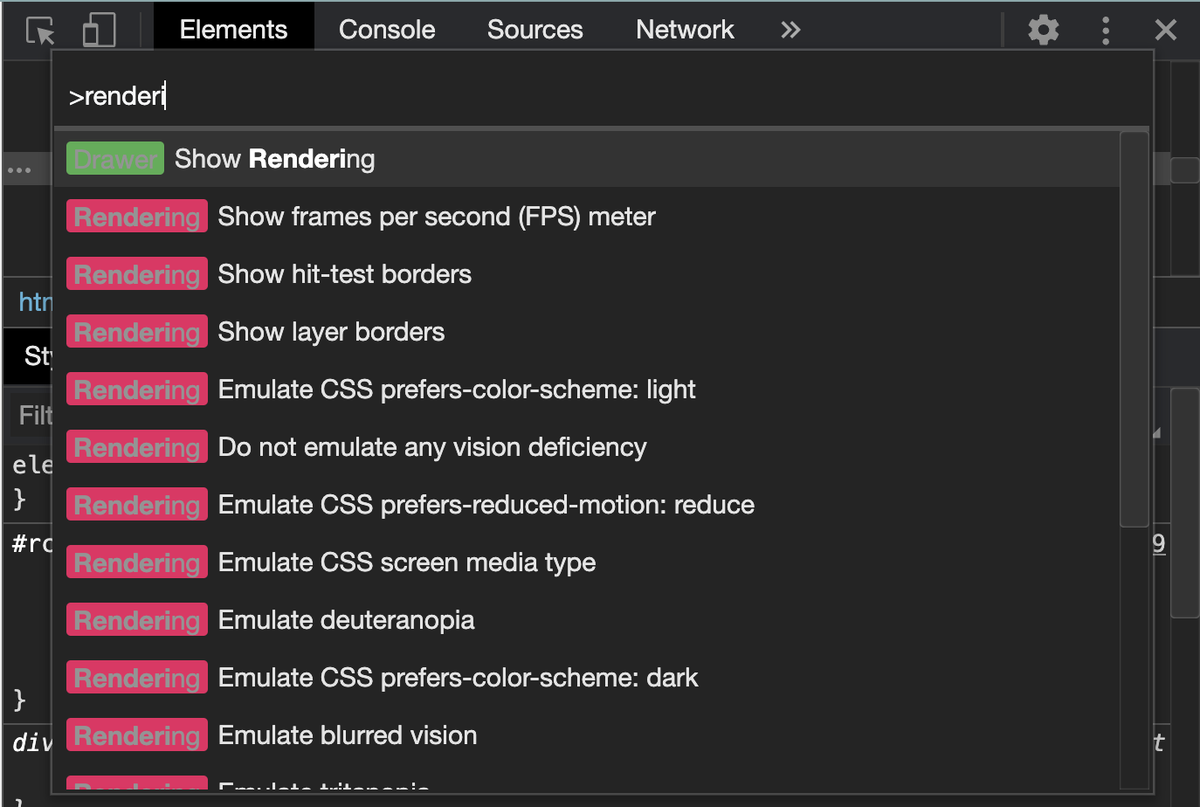
The rendering tab contains many important features, like an FPS counter and paint flashing
Also, did you know about Chrome’s command menu ? Press ⌘+Shift + P or Ctrl + Shift + P in the DevTools. You have a plethora of commands available that may help you investigate rendering, performance, and other issues.
Angular Debugging Tricks — Diving deeper
Source Maps
If you’re seeing TypeScript in your browser, congratulations, your source maps are working.
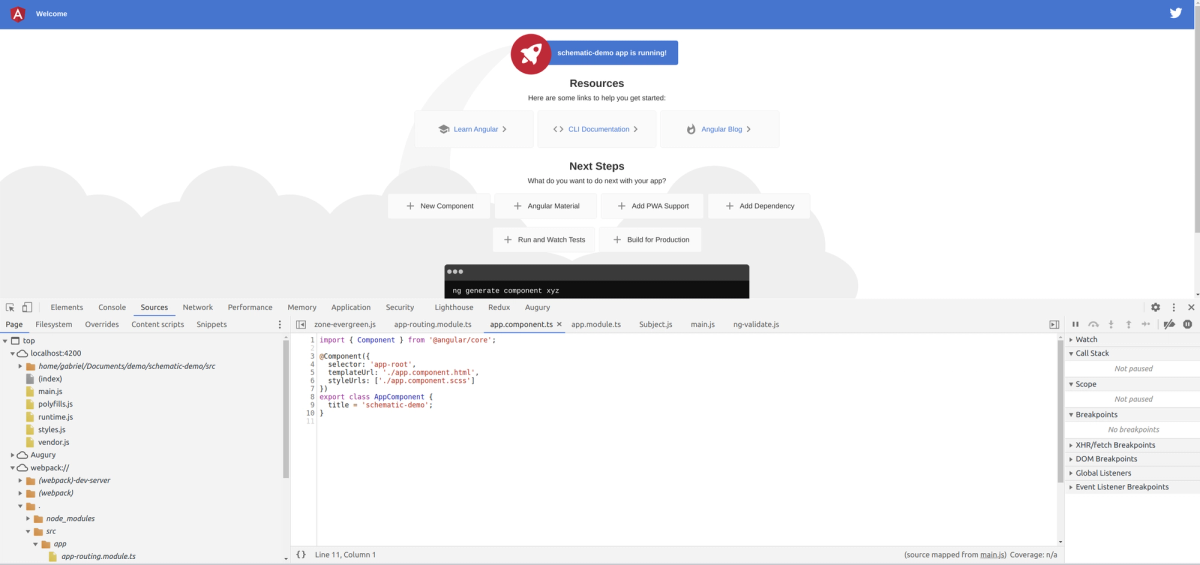
Typescript in the browser!
Chrome has the ability to map the source map files to your JavaScript bundles. This means that you can view your typescript code within the browser, even though typescript is a compiled language. Breakpoints in the typescript code might also work, so knock yourself out.
Here’s what you can try if the breakpoints are not working for you :
1. Use Chrome Canary; this works better for debugging (especially) large files.
2. If all else fails, turn off source maps and use the “ debugger” statement. Debugger breakpoints sometimes allows you to diagnose issues in your code much quicker than conventional console logs.
At this point in time, source maps can be enabled by:
Opening your dev tools > click the Settings cog > Preferences > Sources. Then you can tick “ Enable JS source maps ”. The location of this can change — if it does, check out the official Chrome instructions .
RXJS & NGRX
Lately, we were using Augury , although based on my experience, the plugin has become very buggy and no longer works well in Angular versions 9 and above. To date of this article write up, the changelog says that the last release was in December 2019 . In a Github issue, the author says that the plugin works with Angular Ivy, however I was unable to get it to work on a demo form for this article. Newer versions of the Augury addon are also currently missing features like the router tree and the injector graph. These are available in an older version and when these features are added back, this addon is highly recommended.
If you are using NgRX, you should have a look at the Redux addon . It offers store “time travel”, this mean that you can have your own “back-to-the-future” time machine in your browser!
Debugging RxJS piping can be done using the normal debugger in conjunction with do/tap pipes. Having said this, there is a better way! Check out our previous blog on RxJS, where we go over all the nitty-gritty details, including the addition of rxjs-spy to your project!
Still wanting more?
Getting a component instance can give you valuable debugging information. In the case of forms, you can get which field/s are causing validation issues. In the case of custom components, you can call component functions or read public variables directly within your chrome instance!
To use this functionality, use the Chrome Inspect Tool to select your component, then use:
ng.getComponent($0)
Angular Ivy changed the way we can grab the component instance. Pre-Angular 9, you need to use this:
ng.probe($0).componentInstance
Error Prevention
Errors could be happening due to a variety of reasons; the services might have assumed that the backend API would respond in a timely manner or that the device is always online. These issues could be mitigated by using mocks .
The final catch
When everything else fails, you should use a service to log your errors. One way to go about this is to use an Angular Error Interceptor and send the errors to a backend API directly. You should log as much as possible, but be sure to hide any identifying information on the user (or any user credentials).
Tags

Gabriel Stellini
9th August 2021